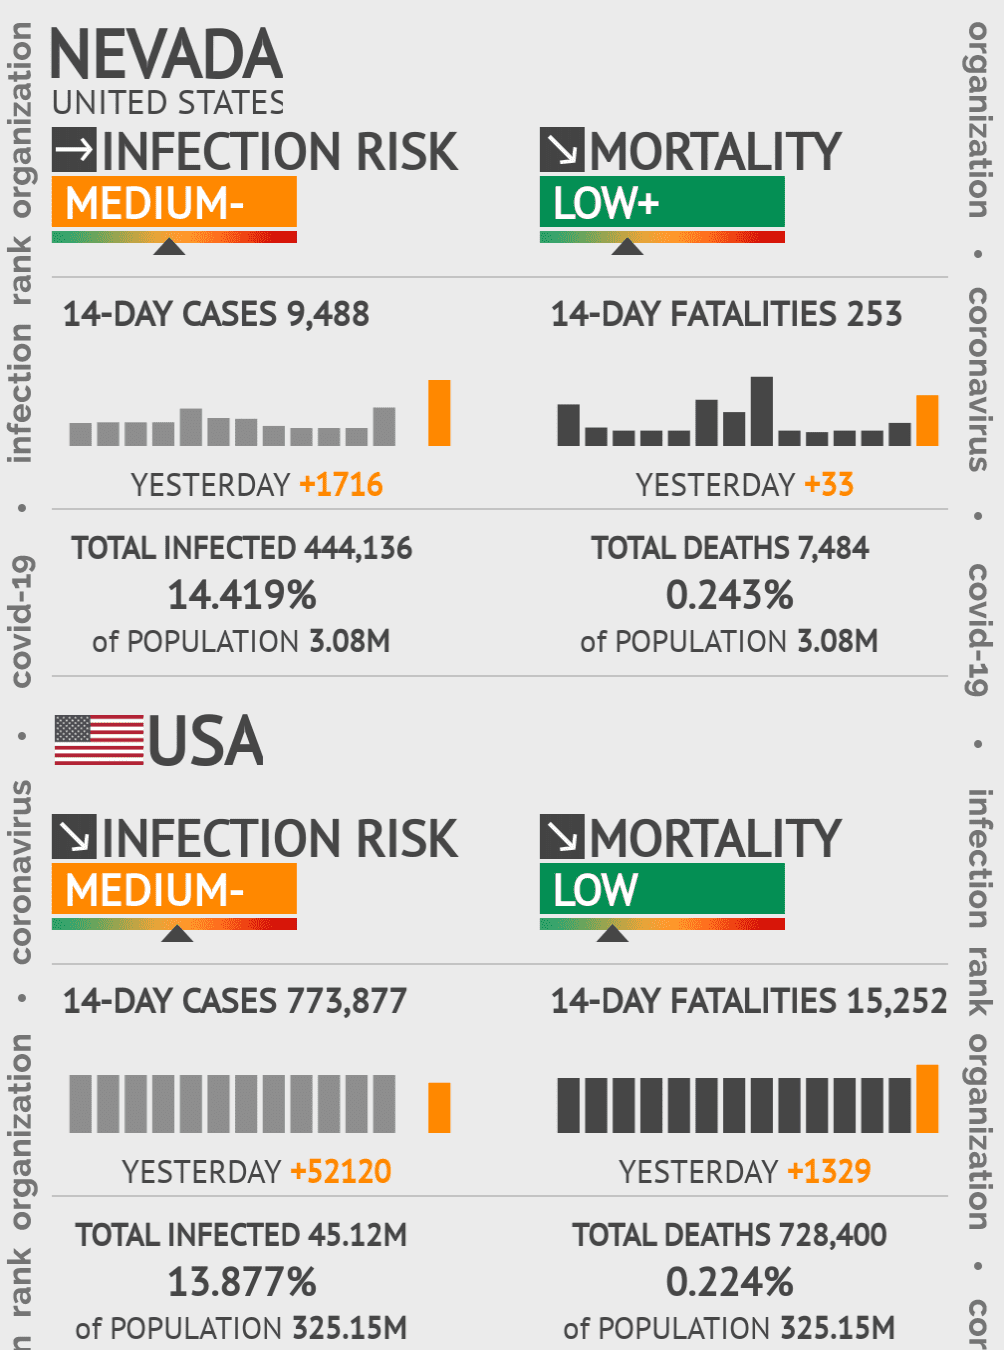
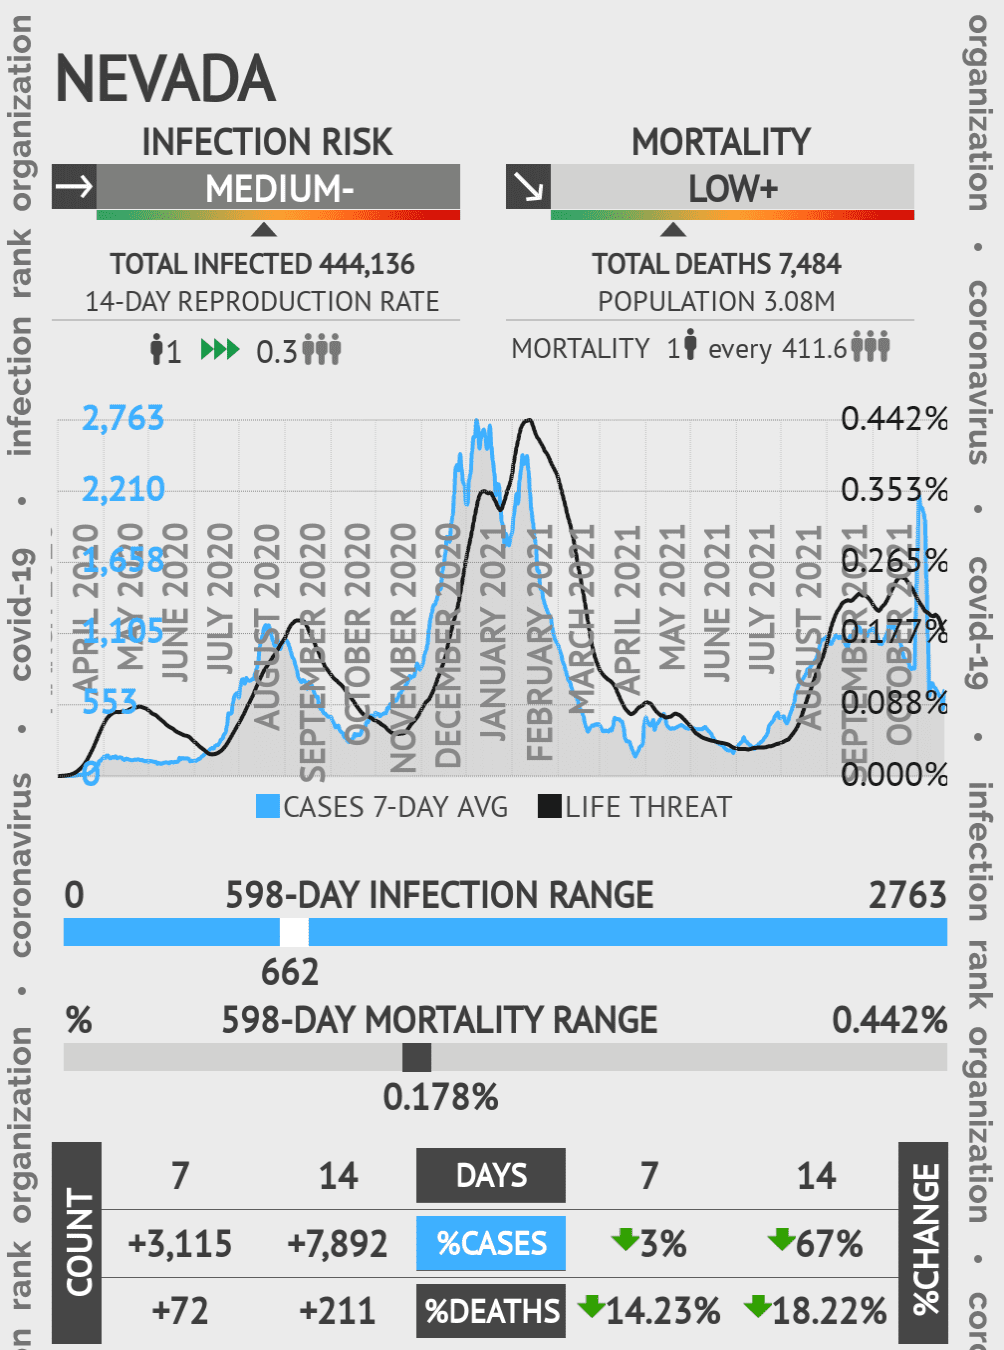
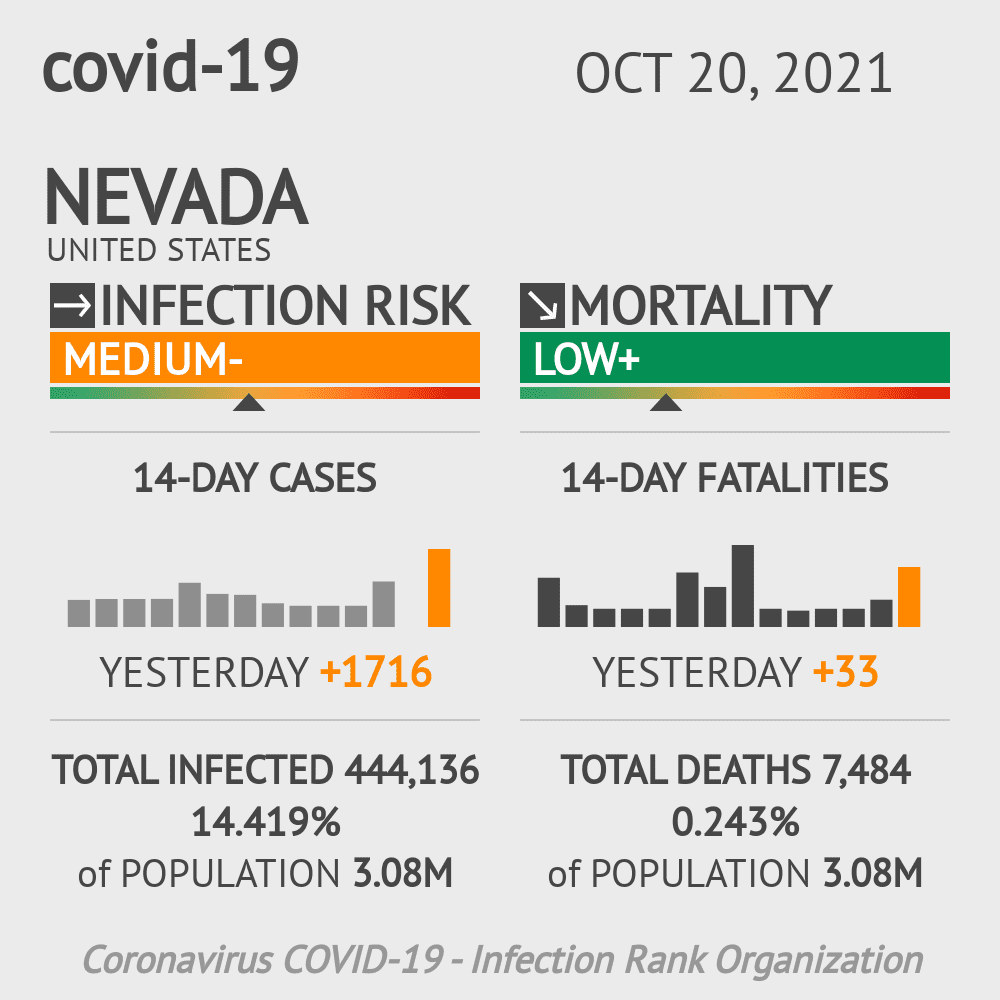
Nevada Coronavirus Covid-19 Risk of Infection Update for 32 Counties on October 20, 2021
INFECTION RISK | MORTALITY | TOTAL INFECTED +Yesterday | TOTAL DEATH +Yesterday | % INFECTED of Population | % MORTALITY of Population |
|---|---|---|---|---|---|
Clark high+ #12of32 COUNTIES | N/A #2of32 COUNTIES | 335,812 +571 | 5,862 +7 | 14.815% 2.27M | 0.259% 2.27M |
Clark County CASES 19% | 14-DAY CHANGE (%) MORTALITY 17% | 326,283 +0 | 5,830 +29 | 14.395% 2.27M | 0.257% 2.27M |
Washoe high+ #8of32 COUNTIES | N/A #12of32 COUNTIES | 63,874 +157 | 883 +3 | 13.546% 472K | 0.187% 472K |
Washoe County CASES 90% | 14-DAY CHANGE (%) MORTALITY 49% | 62,439 +0 | 873 +8 | 13.242% 472K | 0.185% 472K |
Elko high+ #3of32 COUNTIES | N/A #4of32 COUNTIES | 8,657 +76 | 105 +0 | 16.403% 53K | 0.199% 53K |
Elko County CASES 47% | 14-DAY CHANGE (%) MORTALITY 17% | 7,828 +0 | 103 +2 | 14.832% 53K | 0.195% 53K |
Consolidated Municipality of Carson City CASES | 14-DAY CHANGE (%) MORTALITY | 6,503 +1 | 0 +0 | - 0 | - 0 |
Lyon high+ #6of32 COUNTIES | N/A #8of32 COUNTIES | 6,459 +51 | 101 +2 | 11.231% 58K | 0.176% 58K |
Carson City CASES 4388% | 14-DAY CHANGE (%) MORTALITY 11400% | 6,415 +9 | 123 +1 | 11.473% 56K | 0.220% 56K |
Lyon County CASES 55% | 14-DAY CHANGE (%) MORTALITY 45% | 6,205 +0 | 99 +0 | 10.789% 58K | 0.172% 58K |
Carson City County CASES 4617% | 14-DAY CHANGE (%) MORTALITY | 5,543 +251 | 92 +12 | 10.167% 55K | 0.169% 55K |
Douglas high+ #9of32 COUNTIES | N/A #3of32 COUNTIES | 4,616 +24 | 53 +0 | 9.439% 49K | 0.108% 49K |
Douglas County CASES 31% | 14-DAY CHANGE (%) MORTALITY 25% | 4,504 +0 | 53 +0 | 9.210% 49K | 0.108% 49K |
Nye high+ #10of32 COUNTIES | N/A #10of32 COUNTIES | 4,437 +9 | 152 +0 | 9.537% 47K | 0.327% 47K |
Nye County CASES 1% | 14-DAY CHANGE (%) MORTALITY 63% | 4,283 +0 | 148 +5 | 9.206% 47K | 0.318% 47K |
Churchill high+ #4of32 COUNTIES | N/A #1of32 COUNTIES | 3,700 +10 | 61 +1 | 14.854% 25K | 0.245% 25K |
Churchill County CASES 15% | 14-DAY CHANGE (%) MORTALITY 100% | 3,574 +0 | 60 +0 | 14.348% 25K | 0.241% 25K |
Humboldt high+ #1of32 COUNTIES | N/A #5of32 COUNTIES | 2,454 +30 | 27 +2 | 14.580% 17K | 0.160% 17K |
Humboldt County CASES 55% | 14-DAY CHANGE (%) MORTALITY 200% | 2,095 +0 | 25 +1 | 12.447% 17K | 0.149% 17K |
White Pine high+ #2of32 COUNTIES | N/A #13of32 COUNTIES | 1,265 +602 | 10 +2 | 13.205% 10K | 0.104% 10K |
White Pine County CASES 1% | 14-DAY CHANGE (%) MORTALITY | 1,150 +0 | 10 +0 | 12.004% 10K | 0.104% 10K |
Pershing County CASES 100% | 14-DAY CHANGE (%) MORTALITY | 954 +0 | 0 +0 | 14.186% 7K | 0.000% 7K |
Lander high+ #5of32 COUNTIES | N/A #6of32 COUNTIES | 789 +2 | 14 +0 | 14.262% 6K | 0.253% 6K |
Lander County CASES 25% | 14-DAY CHANGE (%) MORTALITY | 703 +1 | 14 +0 | 12.708% 6K | 0.253% 6K |
Mineral high+ #7of32 COUNTIES | N/A #9of32 COUNTIES | 552 +211 | 11 +3 | 12.253% 5K | 0.244% 5K |
Mineral County CASES 56% | 14-DAY CHANGE (%) MORTALITY 100% | 541 +0 | 11 +0 | 12.009% 5K | 0.244% 5K |
Lincoln high+ #11of32 COUNTIES | N/A #7of32 COUNTIES | 520 +5 | 5 +0 | 10.033% 5K | 0.096% 5K |
Lincoln County CASES 9% | 14-DAY CHANGE (%) MORTALITY | 509 +0 | 5 +0 | 9.821% 5K | 0.096% 5K |
Storey high+ #13of32 COUNTIES | N/A #11of32 COUNTIES | 204 +79 | 4 +1 | 4.948% 4K | 0.097% 4K |
Storey County CASES 68% | 14-DAY CHANGE (%) MORTALITY | 198 +0 | 4 +0 | 4.802% 4K | 0.097% 4K |
Eureka County CASES 33% | 14-DAY CHANGE (%) MORTALITY | 55 +0 | 0 +0 | 2.711% 2K | 0.000% 2K |
Esmeralda County CASES | 14-DAY CHANGE (%) MORTALITY | 38 +0 | 0 +0 | 4.353% 873 | 0.000% 873 |


