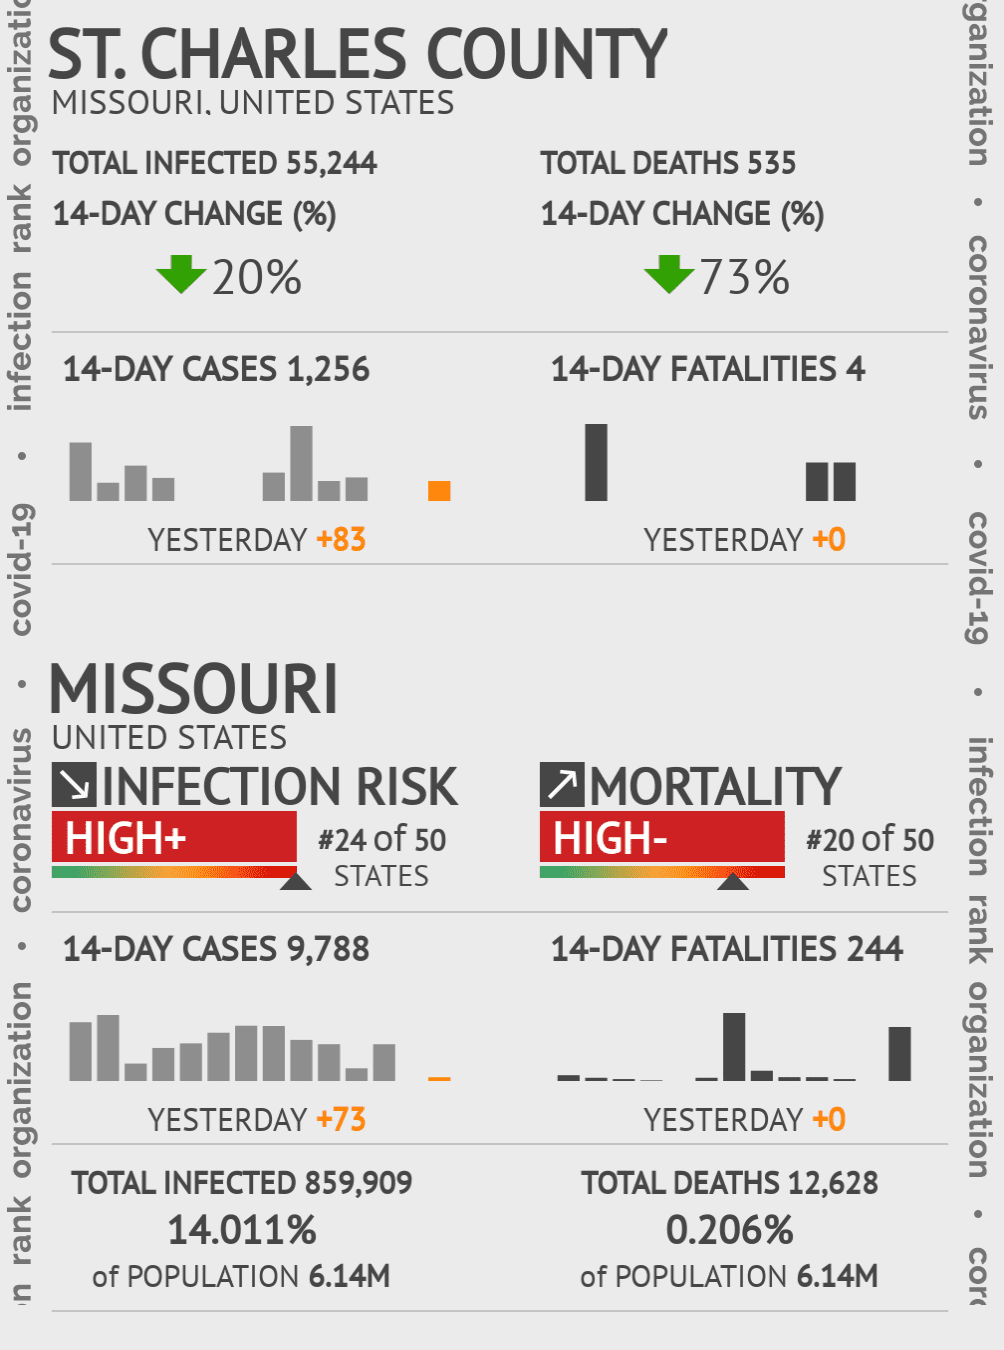
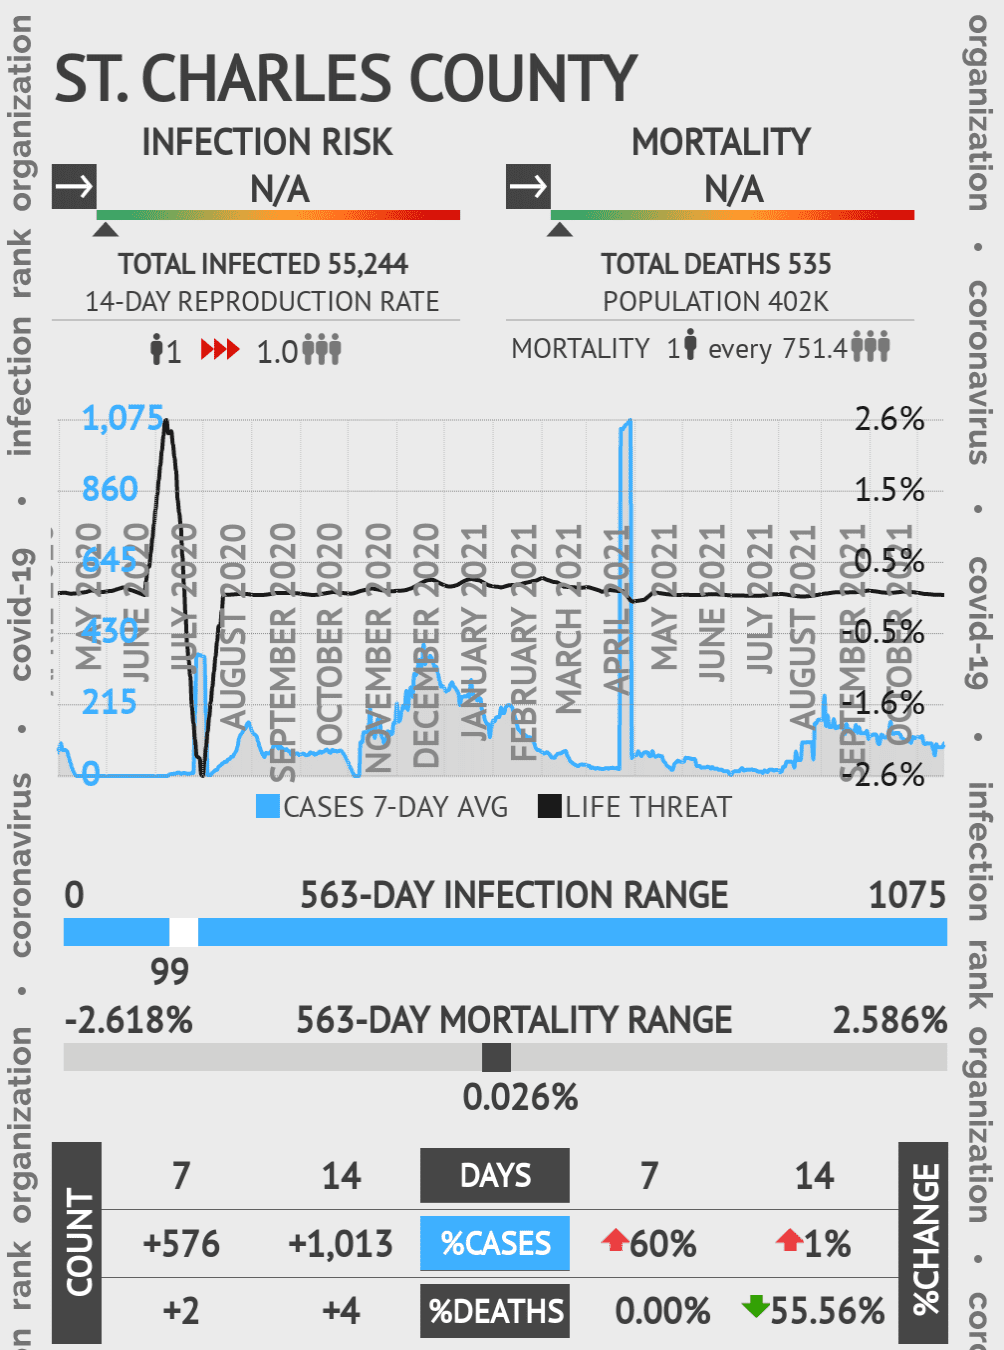
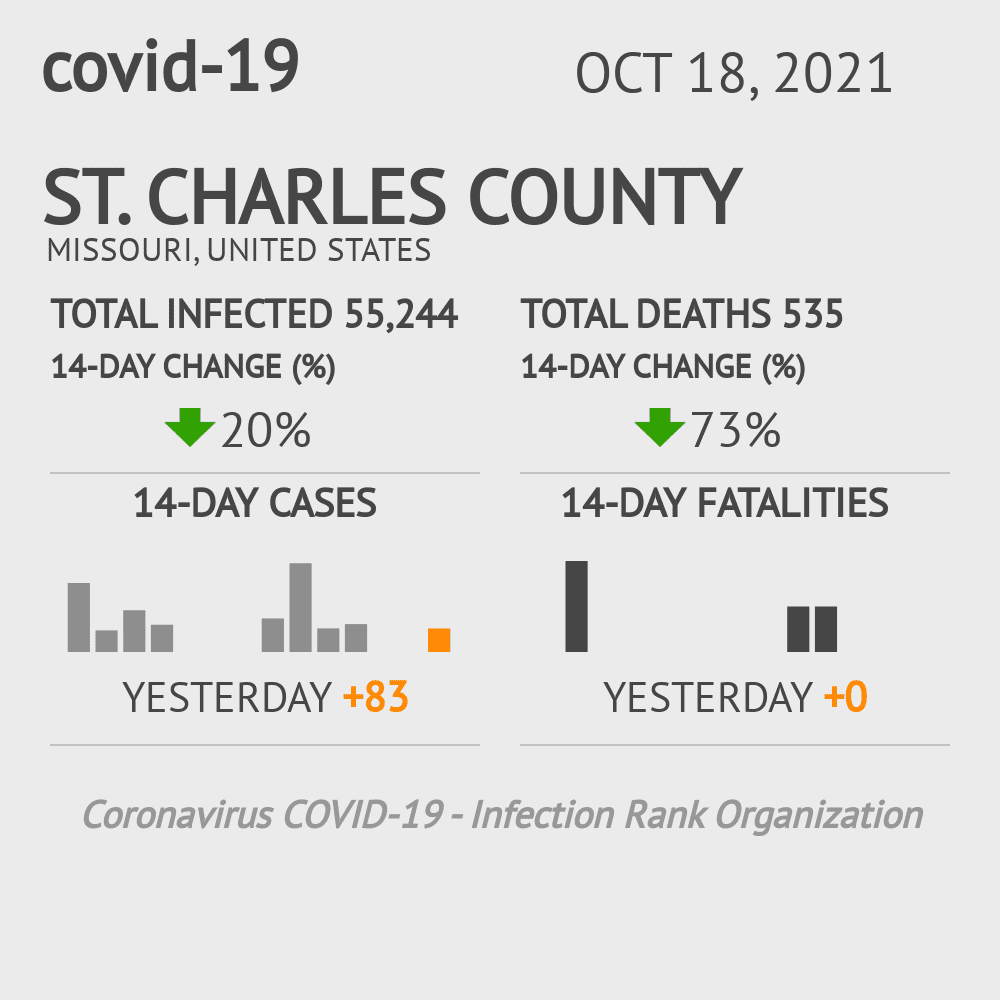
St. Charles Coronavirus Covid-19 Risk of Infection on October 20, 2021
INFECTION RISK | MORTALITY | TOTAL INFECTED +Yesterday | TOTAL DEATH +Yesterday | % INFECTED of Population | % MORTALITY of Population |
|---|---|---|---|---|---|
St. Louis high+ #95of231 COUNTIES | N/A #101of231 COUNTIES | 128,188 +18,767 | 2,533 +211 | 12.894% 994K | 0.255% 994K |
Jackson high+ #102of231 COUNTIES | N/A #48of231 COUNTIES | 62,725 +12,175 | 817 +191 | 8.922% 703K | 0.116% 703K |
Greene high+ #92of231 COUNTIES | N/A #39of231 COUNTIES | 44,479 +5,764 | 665 +116 | 15.176% 293K | 0.227% 293K |
Jefferson high+ #51of231 COUNTIES | N/A #50of231 COUNTIES | 31,874 +6,411 | 324 +64 | 14.161% 225K | 0.144% 225K |
Boone high+ #83of231 COUNTIES | N/A #10of231 COUNTIES | 25,147 +3,942 | 166 +46 | 13.935% 180K | 0.092% 180K |
Jackson County (including other portions of Kansas City) medium+ #11of231 COUNTIES | N/A #115of231 COUNTIES | 64,333 +0 | 0 +0 | 9.151% 703K | 0.000% 703K |
St. Louis City low #4of231 COUNTIES | medium+ #1of231 COUNTIES | 1,186 +81 | 57 +0 | 0.395% 301K | 0.019% 301K |
DeKalb County min #41of231 COUNTIES | N/A #99of231 COUNTIES | 4 +0 | 0 +0 | 0.032% 13K | 0.000% 13K |


