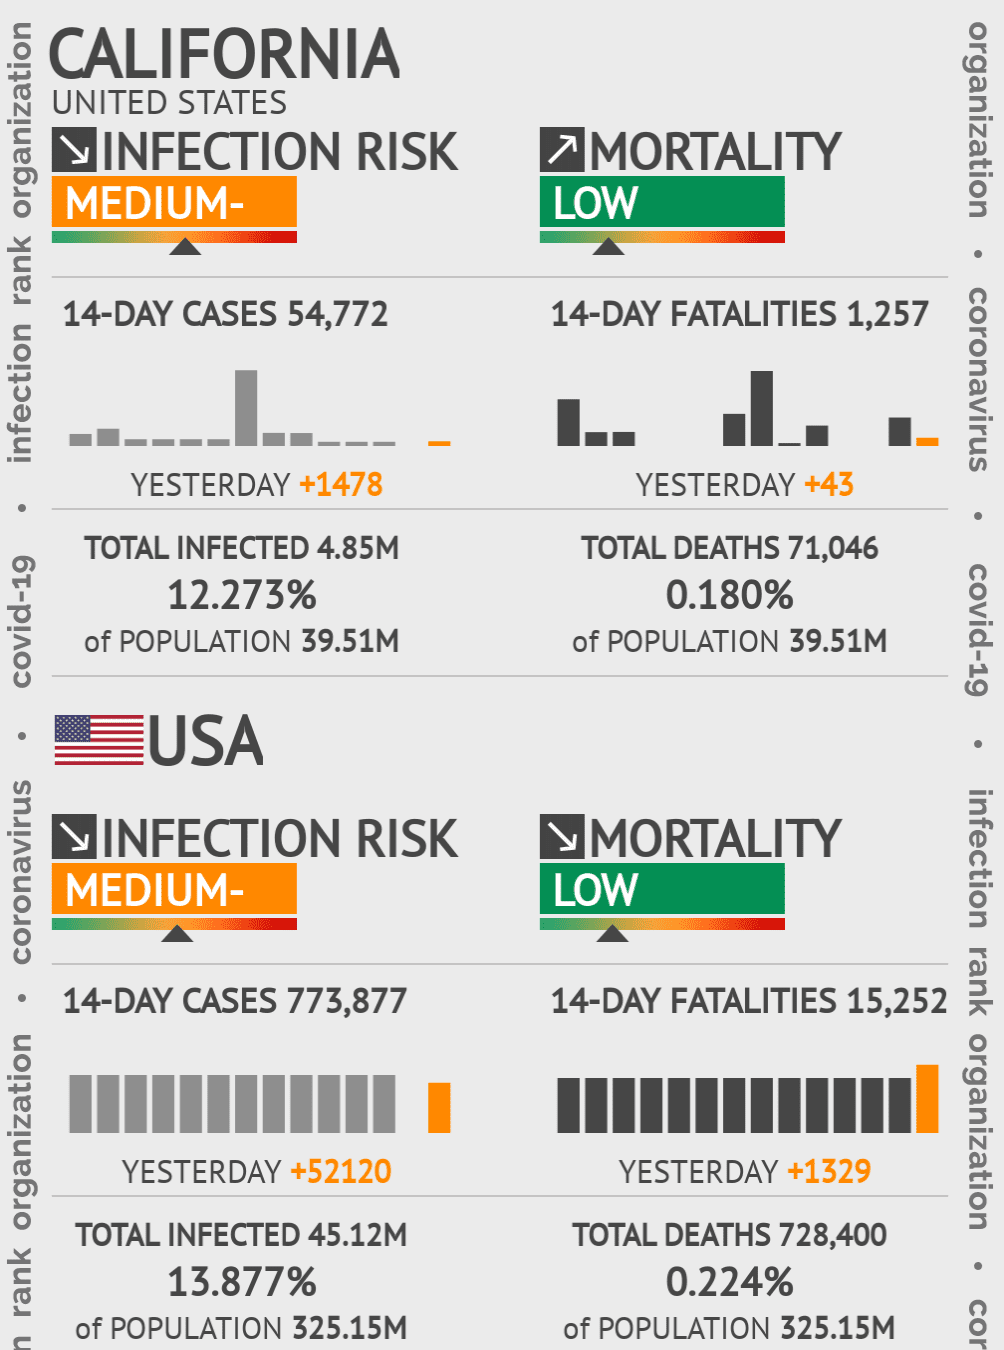
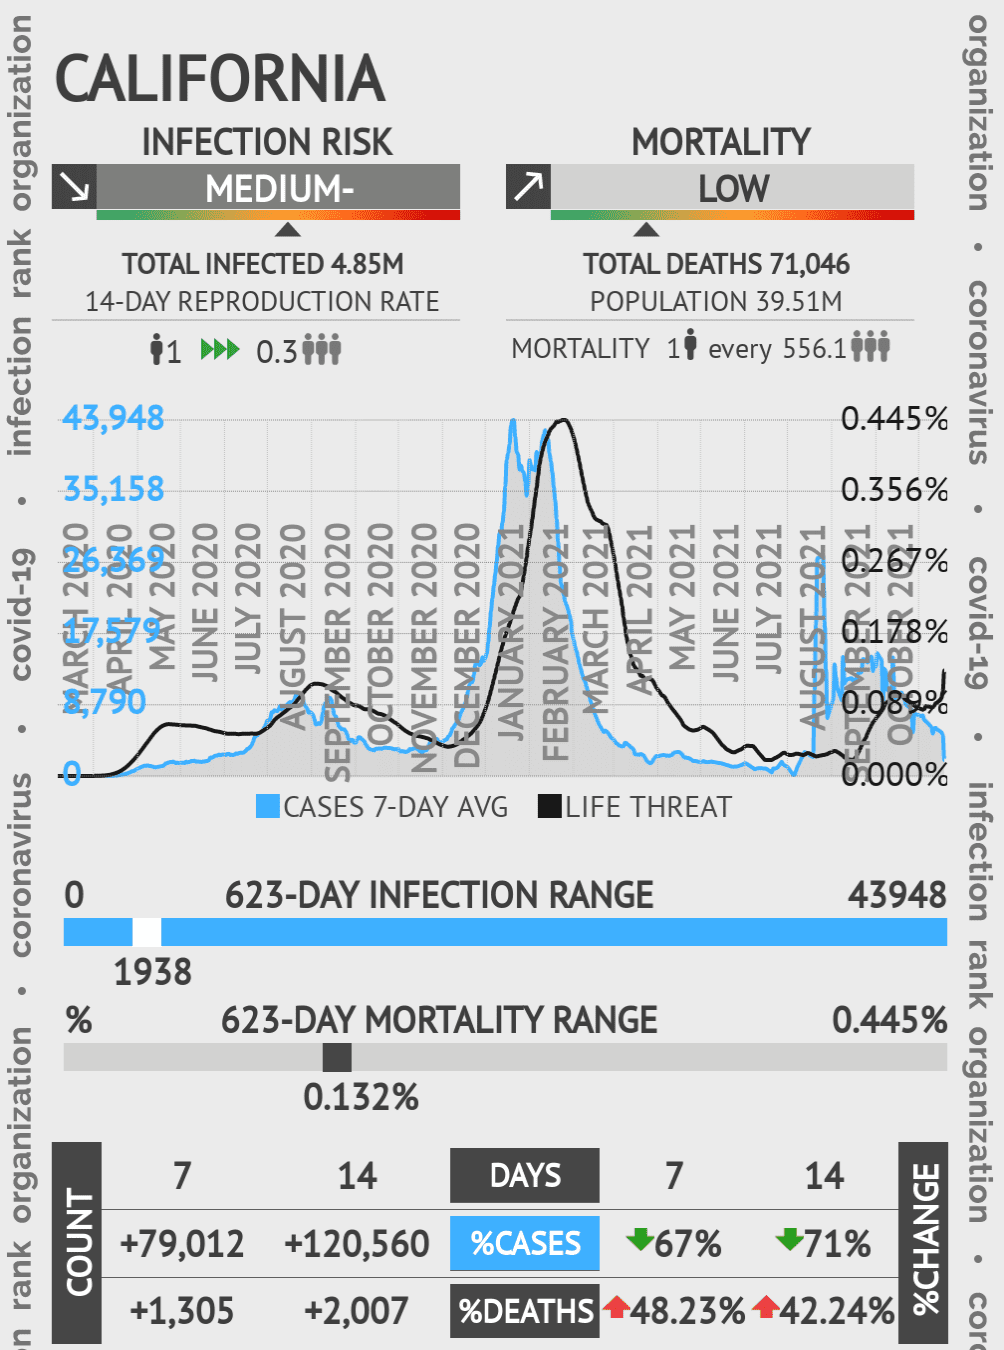
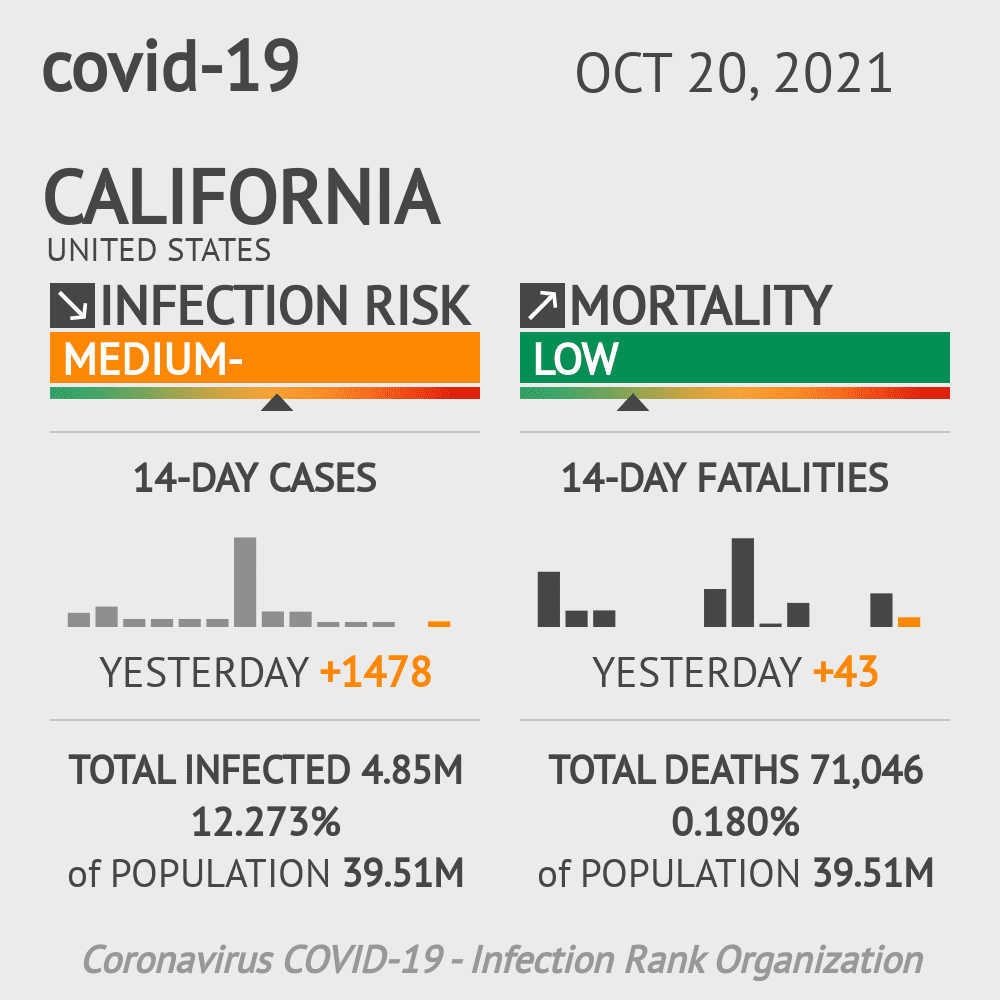
California Coronavirus Covid-19 Risk of Infection Update for 118 Counties on October 20, 2021
INFECTION RISK | MORTALITY | TOTAL INFECTED +Yesterday | TOTAL DEATH +Yesterday | % INFECTED of Population | % MORTALITY of Population |
|---|---|---|---|---|---|
Los Angeles high+ #43of118 COUNTIES | N/A #19of118 COUNTIES | 1.48M +799 | 26,446 +0 | 14.744% 10.04M | 0.263% 10.04M |
Los Angeles County CASES 41% | 14-DAY CHANGE (%) MORTALITY 12% | 1.47M +0 | 26,379 +17 | 14.688% 10.04M | 0.263% 10.04M |
San Diego high+ #40of118 COUNTIES | N/A #36of118 COUNTIES | 381,783 +64,759 | 4,169 +366 | 11.436% 3.34M | 0.125% 3.34M |
Riverside high+ #36of118 COUNTIES | N/A #32of118 COUNTIES | 370,608 +51,640 | 5,108 +441 | 15.001% 2.47M | 0.207% 2.47M |
Riverside County CASES 39% | 14-DAY CHANGE (%) MORTALITY 1% | 368,953 +0 | 4,978 +5 | 14.934% 2.47M | 0.201% 2.47M |
San Diego County CASES 45% | 14-DAY CHANGE (%) MORTALITY 3% | 363,169 +0 | 4,151 +10 | 10.879% 3.34M | 0.124% 3.34M |
San Bernardino high+ #38of118 COUNTIES | N/A #35of118 COUNTIES | 357,639 +44,595 | 5,606 +341 | 16.405% 2.18M | 0.257% 2.18M |
San Bernardino County CASES 41% | 14-DAY CHANGE (%) MORTALITY 74% | 355,848 +0 | 5,563 +0 | 16.323% 2.18M | 0.255% 2.18M |
Orange high+ #51of118 COUNTIES | N/A #29of118 COUNTIES | 323,569 +162 | 5,531 +3 | 10.189% 3.18M | 0.174% 3.18M |
Orange County CASES 51% | 14-DAY CHANGE (%) MORTALITY 1% | 322,497 +0 | 5,513 +5 | 10.155% 3.18M | 0.174% 3.18M |
Sacramento high+ #32of118 COUNTIES | N/A #33of118 COUNTIES | 158,784 +38,804 | 2,294 +506 | 10.231% 1.55M | 0.148% 1.55M |
Sacramento County CASES 25% | 14-DAY CHANGE (%) MORTALITY 23% | 157,498 +0 | 2,273 +17 | 10.148% 1.55M | 0.146% 1.55M |
Fresno high+ #27of118 COUNTIES | N/A #10of118 COUNTIES | 145,378 +30,056 | 2,063 +317 | 14.551% 999K | 0.206% 999K |
Kern high+ #18of118 COUNTIES | N/A #15of118 COUNTIES | 145,227 +313 | 1,616 +1 | 16.133% 900K | 0.180% 900K |
Santa Clara high+ #56of118 COUNTIES | N/A #42of118 COUNTIES | 145,127 +20,313 | 1,896 +0 | 7.528% 1.93M | 0.098% 1.93M |
Santa Clara County CASES 6% | 14-DAY CHANGE (%) MORTALITY 20% | 144,300 +146 | 1,886 +4 | 7.485% 1.93M | 0.098% 1.93M |
Fresno County CASES 20% | 14-DAY CHANGE (%) MORTALITY 24% | 143,745 +0 | 2,048 +6 | 14.387% 999K | 0.205% 999K |
Kern County CASES 10% | 14-DAY CHANGE (%) MORTALITY 83% | 143,716 +0 | 1,600 +3 | 15.965% 900K | 0.178% 900K |
Alameda high+ #50of118 COUNTIES | N/A #1of118 COUNTIES | 120,387 +20,746 | 1,384 +98 | 7.203% 1.67M | 0.083% 1.67M |
Alameda County CASES 2% | 14-DAY CHANGE (%) MORTALITY 30% | 119,774 +124 | 1,365 +7 | 7.166% 1.67M | 0.082% 1.67M |
San Joaquin high+ #30of118 COUNTIES | N/A #38of118 COUNTIES | 102,341 +20,605 | 1,726 +265 | 13.428% 762K | 0.226% 762K |
San Joaquin County CASES 44% | 14-DAY CHANGE (%) MORTALITY 67% | 101,643 +0 | 1,696 +6 | 13.336% 762K | 0.223% 762K |
Ventura high+ #47of118 COUNTIES | N/A #55of118 COUNTIES | 100,849 +12,948 | 1,165 +119 | 11.921% 846K | 0.138% 846K |
Ventura County CASES 27% | 14-DAY CHANGE (%) MORTALITY 46% | 100,442 +0 | 1,162 +2 | 11.872% 846K | 0.137% 846K |
Contra Costa high+ #41of118 COUNTIES | N/A #7of118 COUNTIES | 99,712 +20,422 | 995 +159 | 8.644% 1.15M | 0.086% 1.15M |
Contra Costa County CASES 31% | 14-DAY CHANGE (%) MORTALITY 620% | 99,102 +0 | 969 +9 | 8.591% 1.15M | 0.084% 1.15M |
Stanislaus high+ #16of118 COUNTIES | N/A #49of118 COUNTIES | 85,750 +108 | 1,325 +6 | 15.572% 551K | 0.241% 551K |
Stanislaus County CASES 14% | 14-DAY CHANGE (%) MORTALITY 52% | 84,923 +0 | 1,310 +8 | 15.422% 551K | 0.238% 551K |
Tulare high+ #12of118 COUNTIES | N/A #53of118 COUNTIES | 79,627 +18,820 | 958 +104 | 17.080% 466K | 0.205% 466K |
Tulare County CASES 24% | 14-DAY CHANGE (%) MORTALITY 208% | 78,753 +0 | 945 +1 | 16.893% 466K | 0.203% 466K |
San Francisco high+ #49of118 COUNTIES | N/A #37of118 COUNTIES | 54,269 +10,908 | 645 +82 | 6.156% 882K | 0.073% 882K |
San Mateo high+ #55of118 COUNTIES | N/A #40of118 COUNTIES | 54,023 +8,196 | 622 +34 | 7.047% 767K | 0.081% 767K |
San Francisco County CASES 29% | 14-DAY CHANGE (%) MORTALITY 58% | 53,974 +0 | 644 +1 | 6.123% 882K | 0.073% 882K |
San Mateo County CASES 20% | 14-DAY CHANGE (%) MORTALITY 60% | 53,781 +57 | 618 +0 | 7.016% 767K | 0.081% 767K |
Monterey high+ #53of118 COUNTIES | N/A #26of118 COUNTIES | 50,792 +4,902 | 587 +59 | 11.702% 434K | 0.135% 434K |
Monterey County CASES 48% | 14-DAY CHANGE (%) MORTALITY 83% | 50,676 +0 | 582 +0 | 11.675% 434K | 0.134% 434K |
Solano high+ #37of118 COUNTIES | N/A #47of118 COUNTIES | 45,939 +9,265 | 339 +76 | 10.262% 448K | 0.076% 448K |
Solano County CASES 31% | 14-DAY CHANGE (%) MORTALITY 44% | 45,734 +0 | 334 +5 | 10.217% 448K | 0.075% 448K |
Santa Barbara high+ #42of118 COUNTIES | N/A #41of118 COUNTIES | 45,047 +7,719 | 522 +53 | 10.089% 446K | 0.117% 446K |
Santa Barbara County CASES 36% | 14-DAY CHANGE (%) MORTALITY 43% | 44,770 +0 | 518 +3 | 10.027% 446K | 0.116% 446K |
Merced high+ #20of118 COUNTIES | N/A #24of118 COUNTIES | 42,481 +9,160 | 585 +100 | 15.299% 278K | 0.211% 278K |
Merced County CASES 33% | 14-DAY CHANGE (%) MORTALITY 47% | 41,680 +0 | 577 +10 | 15.010% 278K | 0.208% 278K |
Sonoma high+ #48of118 COUNTIES | N/A #48of118 COUNTIES | 40,865 +7,226 | 402 +71 | 8.267% 494K | 0.081% 494K |
Sonoma County CASES 19% | 14-DAY CHANGE (%) MORTALITY 60% | 40,638 +0 | 402 +2 | 8.221% 494K | 0.081% 494K |
Placer high+ #28of118 COUNTIES | N/A #30of118 COUNTIES | 39,157 +11,617 | 420 +113 | 9.830% 398K | 0.105% 398K |
Placer County CASES 32% | 14-DAY CHANGE (%) MORTALITY 107% | 38,813 +0 | 412 +7 | 9.744% 398K | 0.103% 398K |
City and County of San Francisco CASES | 14-DAY CHANGE (%) MORTALITY | 36,795 +0 | 0 +0 | - 0 | - 0 |
Imperial high+ #39of118 COUNTIES | N/A #13of118 COUNTIES | 35,832 +3,555 | 764 +19 | 19.773% 181K | 0.422% 181K |
Imperial County CASES 10% | 14-DAY CHANGE (%) MORTALITY 150% | 35,591 +0 | 762 +0 | 19.640% 181K | 0.420% 181K |
Kings high+ #4of118 COUNTIES | N/A #16of118 COUNTIES | 32,649 +7,599 | 320 +69 | 21.348% 153K | 0.209% 153K |
Kings County CASES 29% | 14-DAY CHANGE (%) MORTALITY 21% | 32,197 +0 | 312 +0 | 21.052% 153K | 0.204% 153K |
San Luis Obispo high+ #33of118 COUNTIES | N/A #39of118 COUNTIES | 29,837 +6,830 | 335 +70 | 10.539% 283K | 0.118% 283K |
San Luis Obispo County CASES 53% | 14-DAY CHANGE (%) MORTALITY 30% | 29,590 +0 | 330 +3 | 10.452% 283K | 0.117% 283K |
Madera high+ #17of118 COUNTIES | N/A #20of118 COUNTIES | 23,720 +5,472 | 281 +32 | 15.077% 157K | 0.179% 157K |
Butte high+ #13of118 COUNTIES | N/A #4of118 COUNTIES | 23,673 +8,115 | 265 +60 | 10.800% 219K | 0.121% 219K |
Shasta high+ #5of118 COUNTIES | N/A #44of118 COUNTIES | 23,574 +8,517 | 349 +107 | 13.091% 180K | 0.194% 180K |
Madera County CASES 23% | 14-DAY CHANGE (%) MORTALITY 9% | 23,420 +0 | 281 +0 | 14.886% 157K | 0.179% 157K |
Butte County CASES 40% | 14-DAY CHANGE (%) MORTALITY 17% | 23,298 +0 | 257 +1 | 10.629% 219K | 0.117% 219K |
Shasta County CASES 43% | 14-DAY CHANGE (%) MORTALITY 35% | 23,230 +0 | 334 +0 | 12.900% 180K | 0.185% 180K |
Santa Cruz high+ #52of118 COUNTIES | N/A #43of118 COUNTIES | 20,943 +3,280 | 218 +11 | 7.665% 273K | 0.080% 273K |
Santa Cruz County CASES 37% | 14-DAY CHANGE (%) MORTALITY 33% | 20,830 +0 | 218 +0 | 7.624% 273K | 0.080% 273K |
Yolo high+ #35of118 COUNTIES | N/A #56of118 COUNTIES | 20,266 +4,637 | 248 +33 | 9.191% 221K | 0.112% 221K |
Yolo County CASES 27% | 14-DAY CHANGE (%) MORTALITY 400% | 20,092 +0 | 247 +0 | 9.112% 221K | 0.112% 221K |
Marin high+ #57of118 COUNTIES | N/A #21of118 COUNTIES | 17,665 +2,460 | 244 +1 | 6.825% 259K | 0.094% 259K |
Marin County CASES 33% | 14-DAY CHANGE (%) MORTALITY | 17,570 +0 | 243 +0 | 6.788% 259K | 0.094% 259K |
El Dorado high+ #31of118 COUNTIES | N/A #9of118 COUNTIES | 17,097 +4,950 | 149 +29 | 8.866% 193K | 0.077% 193K |
El Dorado County CASES 25% | 14-DAY CHANGE (%) MORTALITY 44% | 16,947 +0 | 149 +1 | 8.788% 193K | 0.077% 193K |
Sutter high+ #14of118 COUNTIES | N/A #50of118 COUNTIES | 13,861 +3,498 | 172 +45 | 14.294% 97K | 0.177% 97K |
Sutter County CASES 31% | 14-DAY CHANGE (%) MORTALITY 350% | 13,762 +0 | 169 +1 | 14.192% 97K | 0.174% 97K |
Napa high+ #44of118 COUNTIES | N/A #27of118 COUNTIES | 12,865 +2,291 | 100 +16 | 9.340% 138K | 0.073% 138K |
Napa County CASES 14% | 14-DAY CHANGE (%) MORTALITY 300% | 12,797 +0 | 100 +3 | 9.290% 138K | 0.073% 138K |
Yuba high+ #10of118 COUNTIES | N/A #57of118 COUNTIES | 10,435 +20 | 82 +0 | 13.265% 79K | 0.104% 79K |
Yuba County CASES 12% | 14-DAY CHANGE (%) MORTALITY 250% | 9,927 +0 | 80 +10 | 12.619% 79K | 0.102% 79K |
Tehama high+ #2of118 COUNTIES | N/A #51of118 COUNTIES | 9,433 +3,506 | 107 +41 | 14.494% 65K | 0.164% 65K |
Tehama County CASES 24% | 14-DAY CHANGE (%) MORTALITY 150% | 9,240 +0 | 103 +0 | 14.197% 65K | 0.158% 65K |
Humboldt high+ #29of118 COUNTIES | N/A #12of118 COUNTIES | 9,180 +3,821 | 108 +54 | 6.772% 136K | 0.080% 136K |
Nevada high+ #24of118 COUNTIES | N/A #28of118 COUNTIES | 9,116 +3,217 | 90 +15 | 9.138% 100K | 0.090% 100K |
Humboldt County CASES 26% | 14-DAY CHANGE (%) MORTALITY 29% | 9,085 +0 | 108 +0 | 6.702% 136K | 0.080% 136K |
Nevada County CASES 33% | 14-DAY CHANGE (%) MORTALITY 50% | 9,025 +0 | 90 +0 | 9.047% 100K | 0.090% 100K |
Mendocino high+ #25of118 COUNTIES | N/A #23of118 COUNTIES | 7,584 +2,754 | 87 +35 | 8.742% 87K | 0.100% 87K |
Mendocino County CASES 46% | 14-DAY CHANGE (%) MORTALITY 85% | 7,516 +0 | 86 +0 | 8.664% 87K | 0.099% 87K |
Lassen high+ #3of118 COUNTIES | N/A #18of118 COUNTIES | 7,499 +36 | 48 +0 | 24.528% 31K | 0.157% 31K |
Lassen County CASES 83% | 14-DAY CHANGE (%) MORTALITY 33% | 7,437 +0 | 43 +0 | 24.325% 31K | 0.141% 31K |
San Benito high+ #46of118 COUNTIES | N/A #34of118 COUNTIES | 7,416 +1,011 | 72 +9 | 11.807% 63K | 0.115% 63K |
San Benito County CASES 11% | 14-DAY CHANGE (%) MORTALITY 75% | 7,359 +0 | 72 +1 | 11.717% 63K | 0.115% 63K |
Tuolumne high+ #11of118 COUNTIES | N/A #54of118 COUNTIES | 6,976 +22 | 111 +0 | 12.805% 54K | 0.204% 54K |
Tuolumne County CASES 24% | 14-DAY CHANGE (%) MORTALITY | 6,717 +0 | 93 +0 | 12.330% 54K | 0.171% 54K |
Lake high+ #19of118 COUNTIES | N/A #17of118 COUNTIES | 6,583 +2,162 | 104 +38 | 10.224% 64K | 0.162% 64K |
Lake County CASES 43% | 14-DAY CHANGE (%) MORTALITY 40% | 6,500 +0 | 103 +6 | 10.095% 64K | 0.160% 64K |
Amador high+ #15of118 COUNTIES | N/A #3of118 COUNTIES | 5,406 +1,418 | 64 +16 | 13.599% 40K | 0.161% 40K |
Amador County CASES 40% | 14-DAY CHANGE (%) MORTALITY 0% | 5,367 +0 | 63 +0 | 13.501% 40K | 0.158% 40K |
Siskiyou high+ #6of118 COUNTIES | N/A #46of118 COUNTIES | 4,614 +2,018 | 62 +22 | 10.597% 44K | 0.142% 44K |
Siskiyou County CASES 42% | 14-DAY CHANGE (%) MORTALITY 100% | 4,427 +0 | 42 +0 | 10.168% 44K | 0.096% 44K |
Glenn high+ #8of118 COUNTIES | N/A #11of118 COUNTIES | 4,342 +1,261 | 41 +14 | 15.293% 28K | 0.144% 28K |
Glenn County CASES 51% | 14-DAY CHANGE (%) MORTALITY | 4,299 +0 | 30 +0 | 15.141% 28K | 0.106% 28K |
Calaveras high+ #22of118 COUNTIES | N/A #5of118 COUNTIES | 3,865 +1,490 | 80 +22 | 8.420% 46K | 0.174% 46K |
Calaveras County CASES 43% | 14-DAY CHANGE (%) MORTALITY 17% | 3,802 +0 | 79 +4 | 8.282% 46K | 0.172% 46K |
Del Norte high+ #1of118 COUNTIES | N/A #8of118 COUNTIES | 3,672 +3 | 41 +0 | 13.203% 28K | 0.147% 28K |
Del Norte County CASES 65% | 14-DAY CHANGE (%) MORTALITY 100% | 3,557 +0 | 39 +0 | 12.789% 28K | 0.140% 28K |
Colusa high+ #26of118 COUNTIES | N/A #6of118 COUNTIES | 3,030 +649 | 18 +0 | 14.062% 22K | 0.084% 22K |
Colusa County CASES 36% | 14-DAY CHANGE (%) MORTALITY | 3,016 +0 | 18 +0 | 13.997% 22K | 0.084% 22K |
Inyo high+ #23of118 COUNTIES | N/A #14of118 COUNTIES | 2,055 +582 | 40 +2 | 11.392% 18K | 0.222% 18K |
Inyo County CASES 18% | 14-DAY CHANGE (%) MORTALITY | 1,942 +0 | 39 +0 | 10.766% 18K | 0.216% 18K |
Mono high+ #34of118 COUNTIES | N/A #25of118 COUNTIES | 1,664 +328 | 5 +0 | 11.520% 14K | 0.035% 14K |
Mono County CASES 0% | 14-DAY CHANGE (%) MORTALITY | 1,628 +0 | 5 +0 | 11.271% 14K | 0.035% 14K |
Plumas high+ #9of118 COUNTIES | N/A #31of118 COUNTIES | 1,612 +817 | 6 +0 | 8.571% 19K | 0.032% 19K |
Plumas County CASES 118% | 14-DAY CHANGE (%) MORTALITY | 1,547 +0 | 6 +0 | 8.226% 19K | 0.032% 19K |
Mariposa high+ #7of118 COUNTIES | N/A #22of118 COUNTIES | 1,323 +15 | 15 +0 | 7.691% 17K | 0.087% 17K |
Mariposa County CASES 1% | 14-DAY CHANGE (%) MORTALITY 100% | 1,262 +0 | 15 +0 | 7.336% 17K | 0.087% 17K |
Trinity high+ #21of118 COUNTIES | N/A #52of118 COUNTIES | 870 +401 | 11 +5 | 7.082% 12K | 0.090% 12K |
Trinity County CASES 51% | 14-DAY CHANGE (%) MORTALITY | 858 +0 | 11 +0 | 6.984% 12K | 0.090% 12K |
Yuba/Sutter CASES | 14-DAY CHANGE (%) MORTALITY | 508 +320 | 7 +4 | - 0 | - 0 |
Modoc County CASES 81% | 14-DAY CHANGE (%) MORTALITY 100% | 364 +2 | 0 +0 | 4.117% 9K | 0.000% 9K |
Sierra high+ #45of118 COUNTIES | N/A #45of118 COUNTIES | 182 +49 | 0 +0 | 6.057% 3K | 0.000% 3K |
Sierra County CASES | 14-DAY CHANGE (%) MORTALITY | 171 +2 | 0 +0 | 5.691% 3K | 0.000% 3K |
Alpine high+ #54of118 COUNTIES | N/A #2of118 COUNTIES | 103 +12 | 0 +0 | 9.123% 1K | 0.000% 1K |
Alpine County CASES 100% | 14-DAY CHANGE (%) MORTALITY | 102 +0 | 0 +0 | 9.035% 1K | 0.000% 1K |
Grand Princess Cruise Ship CASES | 14-DAY CHANGE (%) MORTALITY | 21 +0 | 0 +0 | - 0 | - 0 |


