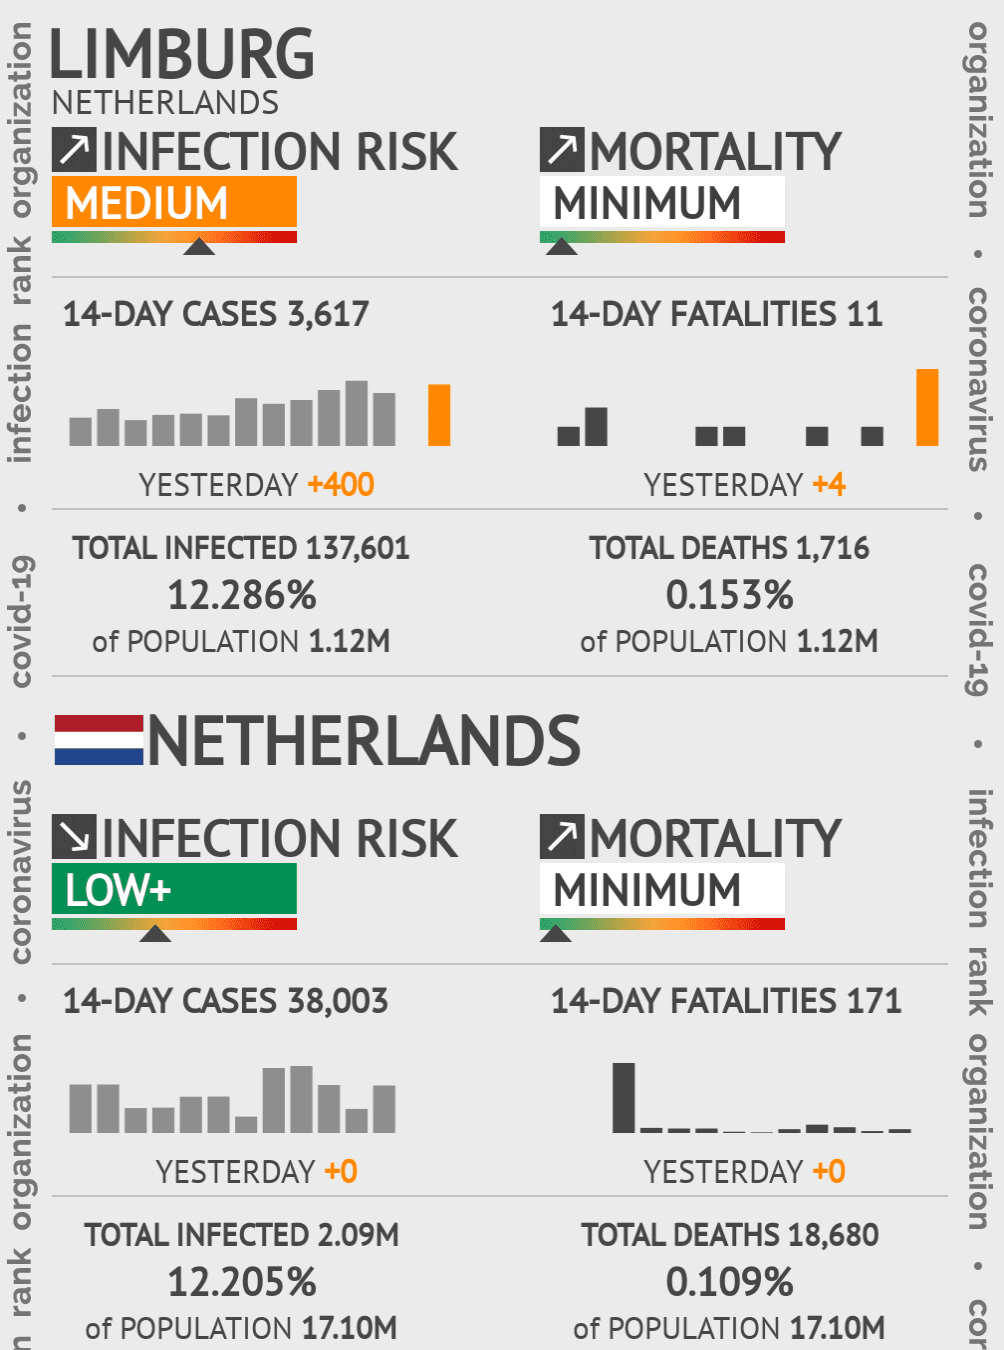
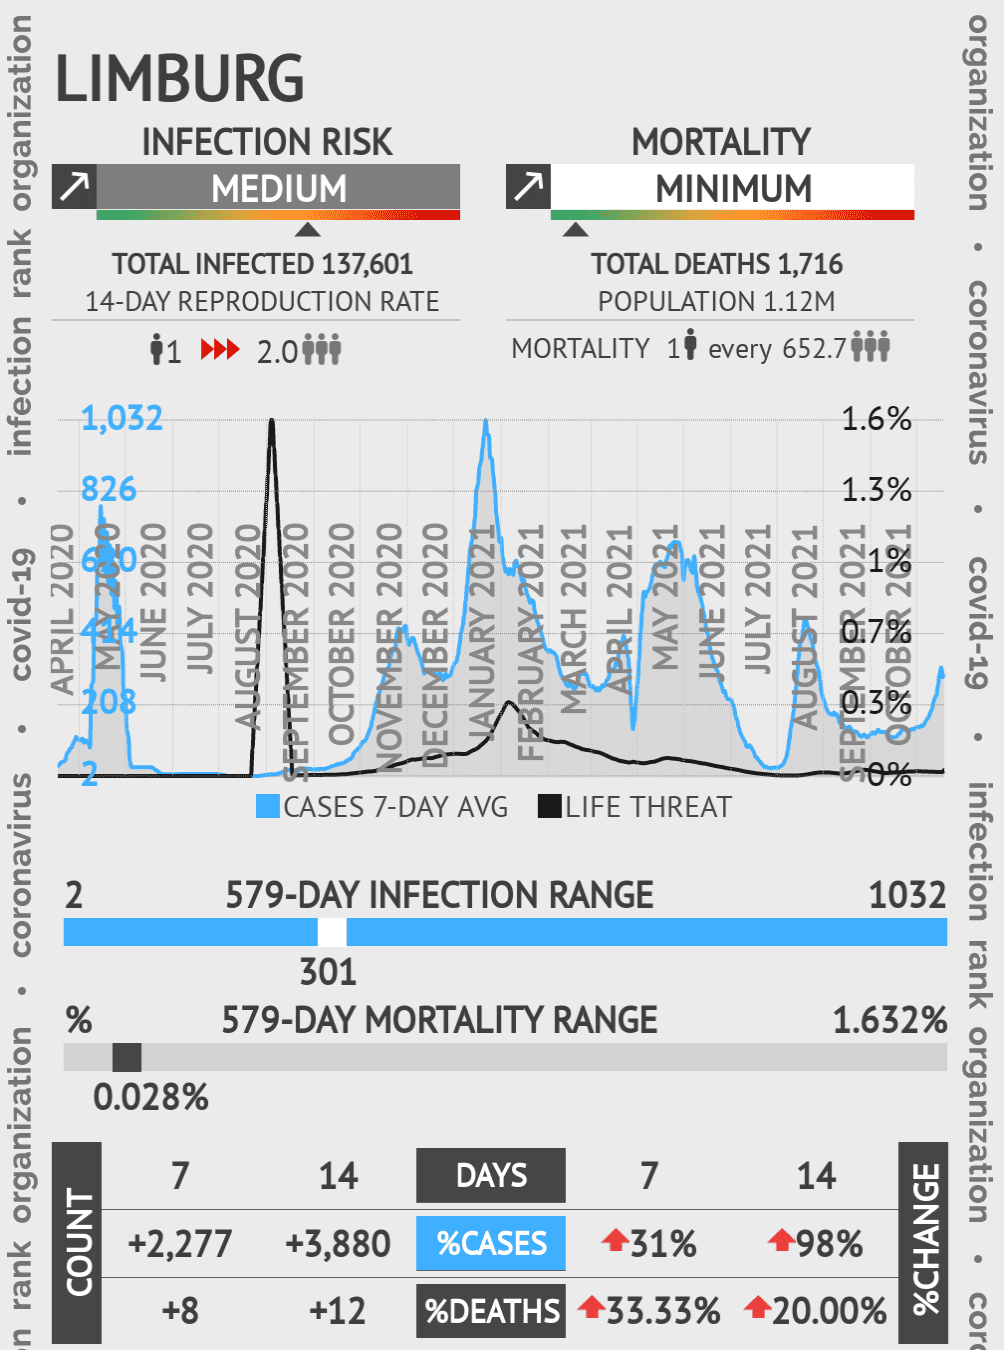
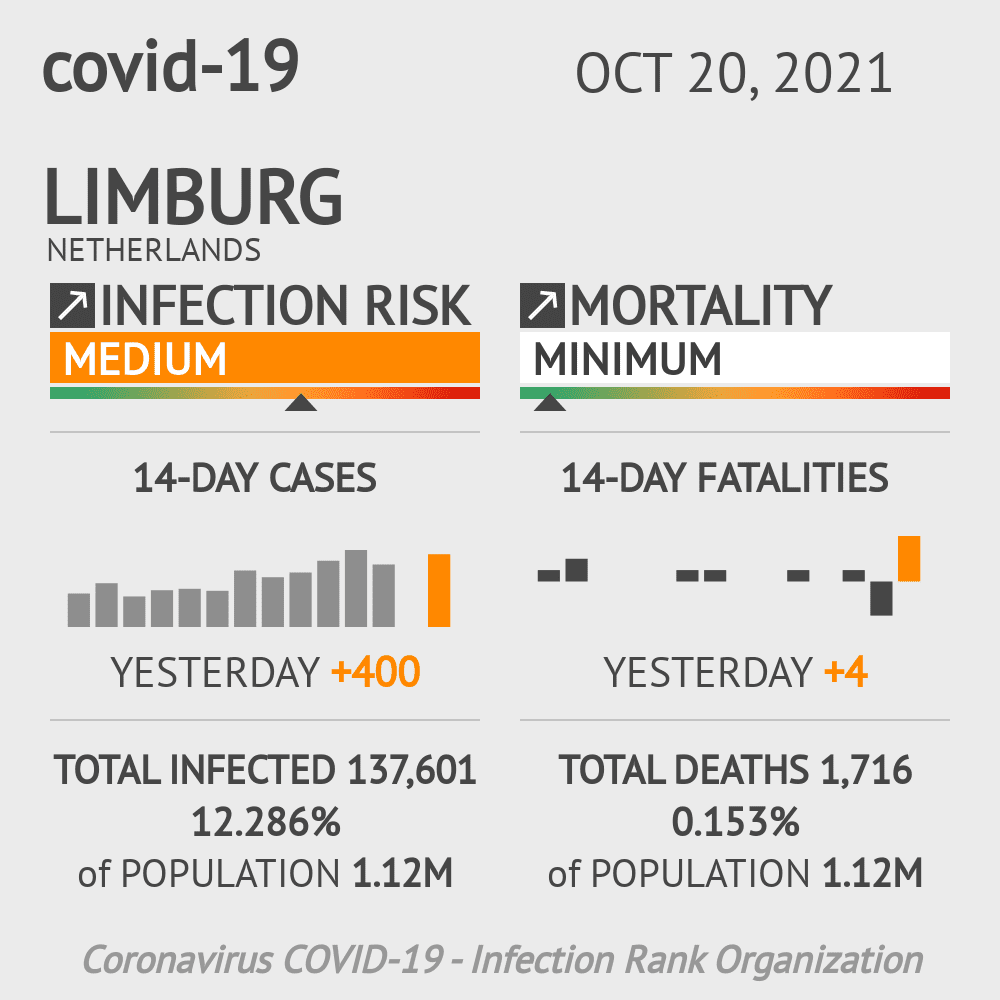
Limburg Coronavirus Covid-19 Risk of Infection on October 20, 2021
INFECTION RISK | MORTALITY | TOTAL INFECTED +Yesterday | TOTAL DEATH +Yesterday | % INFECTED of Population | % MORTALITY of Population |
|---|---|---|---|---|---|
South Holland medium- #6of378 STATES | min #6of378 STATES | 494,095 +985 | 4,408 +1 | 13.813% 3.58M | 0.123% 3.58M |
Gelderland medium- #5of378 STATES | min #8of378 STATES | 229,383 +630 | 2,112 +0 | 11.357% 2.02M | 0.105% 2.02M |
Utrecht medium- #4of378 STATES | min #12of378 STATES | 160,116 +327 | 1,309 +0 | 12.772% 1.25M | 0.104% 1.25M |
Overijssel medium- #3of378 STATES | min #11of378 STATES | 134,590 +388 | 1,171 +0 | 11.782% 1.14M | 0.103% 1.14M |
Friesland medium- #9of378 STATES | min #4of378 STATES | 55,984 +119 | 491 +1 | 8.662% 646K | 0.076% 646K |
North Holland low+ #12of378 STATES | min #5of378 STATES | 353,023 +638 | 2,746 +1 | 12.548% 2.81M | 0.098% 2.81M |
North Brabant low+ #10of378 STATES | min #3of378 STATES | 320,913 +582 | 3,184 +3 | 14.220% 2.26M | 0.141% 2.26M |
Drenthe low+ #11of378 STATES | min #7of378 STATES | 40,849 +89 | 361 +0 | 8.306% 492K | 0.073% 492K |


