Saitama Prefecture Coronavirus Covid-19 Risk of Infection on May 14, 2020

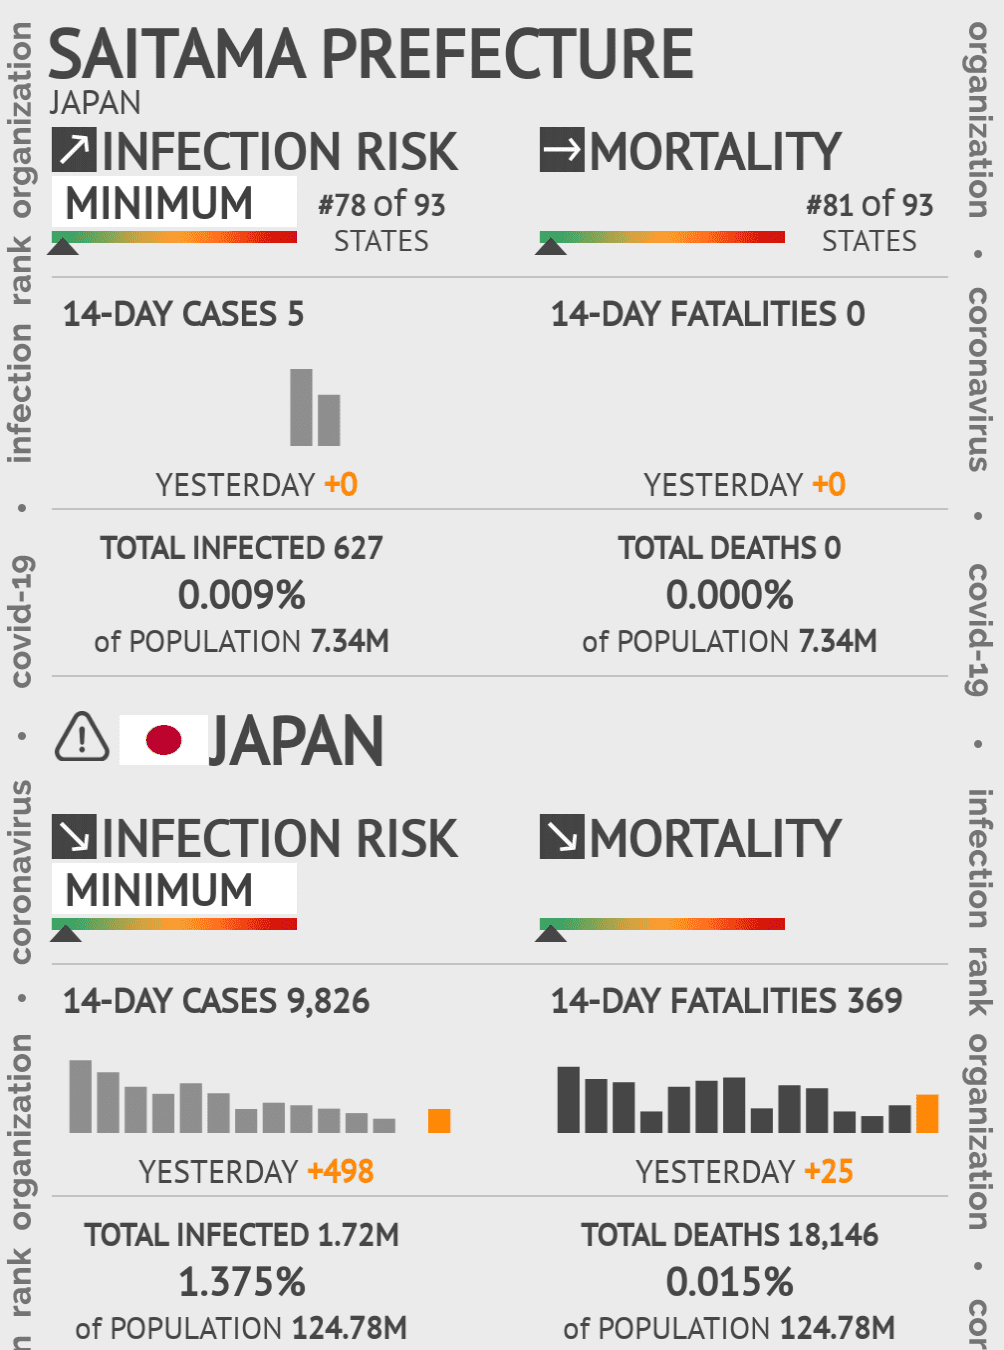
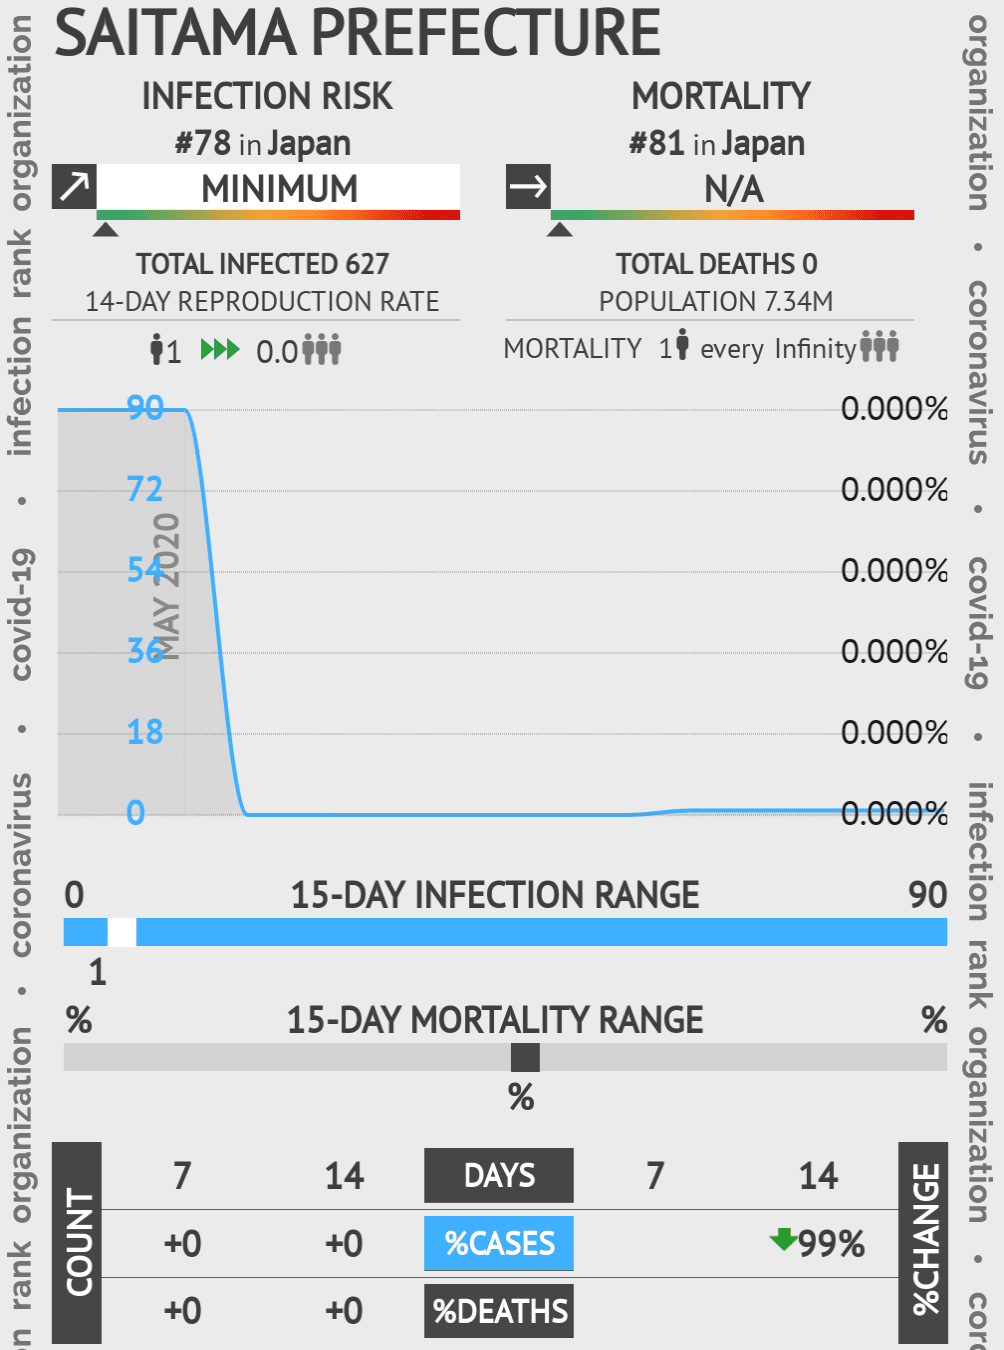
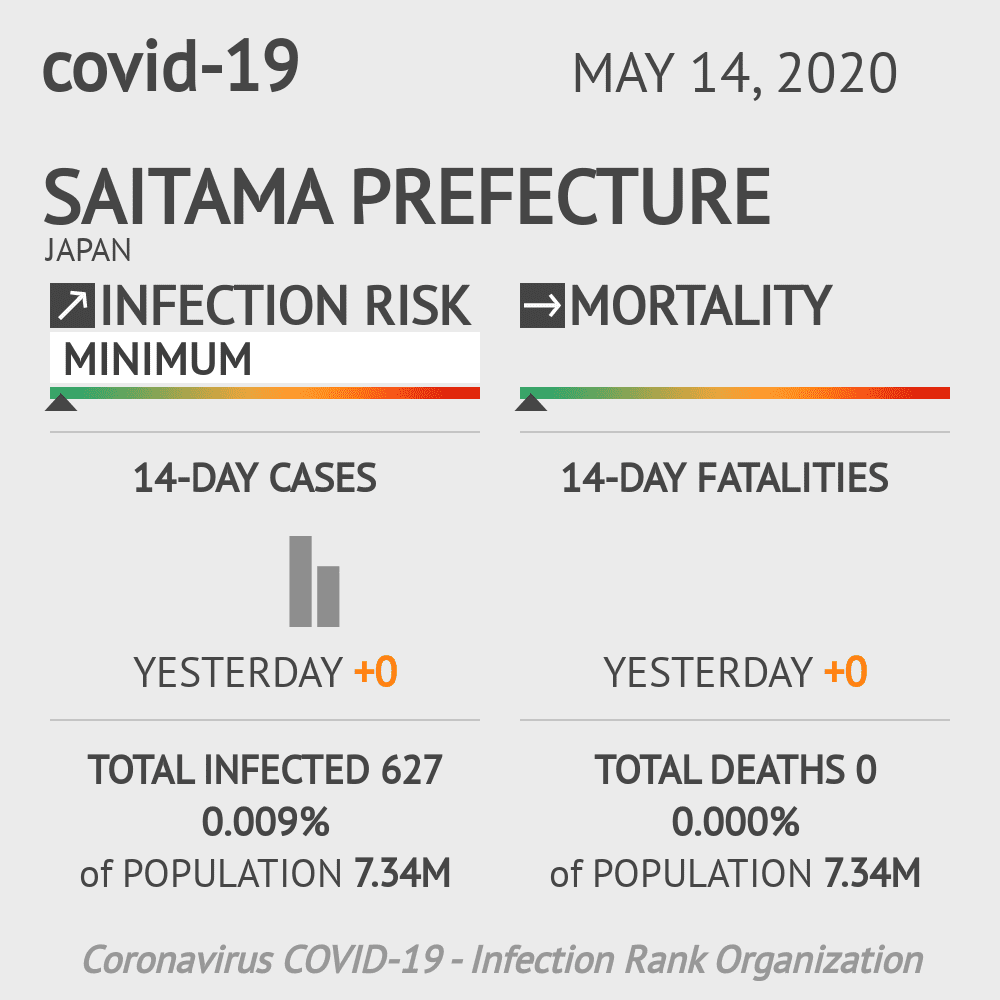
Saitama Prefecture
INFECTION RISK
#78inJapan
min
TOTAL INFECTED 627
14-DAY REPRODUCTION RATE
10.0
MORTALITY
#81inJapan
N/A
TOTAL DEATHS 0
POPULATION 7.34M
MORTALITY1everyInfinity
COUNT714
DAYS
714%CHANGE
+0+0
%CASES
0%99%
Japan
INFECTION RISK
min
TOTAL INFECTED 1.72M
14-DAY REPRODUCTION RATE
10.2
MORTALITY
N/A
TOTAL DEATHS 18,146
POPULATION 124.78M
MORTALITY1every6876.2
COUNT714
DAYS
714%CHANGE
+3,495+12,696
%CASES
52%77%

Compare to other regions

HIGH
MEDIUM
LOW
MIN
INFECTION RISK
MORTALITY
TOTAL INFECTED
+Yesterday
TOTAL DEATH
+Yesterday
% INFECTED
of Population
% MORTALITY
of Population
Tokyo
min
#1of93
STATES
min
#41of93
STATES
99,208
+0
883
+0
0.712%
13.94M
0.006%
13.94M
Osaka
min
#2of93
STATES
min
#33of93
STATES
43,508
+0
915
+0
0.493%
8.82M
0.010%
8.82M
Kanagawa Prefecture
min
#3of93
STATES
min
#19of93
STATES
40,374
+0
461
+0
0.439%
9.20M
0.005%
9.20M
Saitama Prefecture
min
#4of93
STATES
min
#35of93
STATES
24,948
+0
340
+0
0.340%
7.34M
0.005%
7.34M
Aichi Prefecture
min
#5of93
STATES
min
#1of93
STATES
23,775
+0
394
+0
0.315%
7.55M
0.005%
7.55M

FREE WEB WIDGET & WORDPRESS PLUGIN

  • LIGHT
  • DARK
  • INFECTIONRANK.ORG BASIC
    Saitama Prefecture Coronavirus Covid-19 Risk of Infection on May 14, 2020
    GET CODE >
  • INFECTIONRANK.ORG ADVANCED
    Saitama Prefecture Coronavirus Covid-19 Risk of Infection on May 14, 2020
    GET CODE >
  • SQUARE
    Saitama Prefecture Coronavirus Covid-19 Risk of Infection on May 14, 2020
    GET CODE >
  • HORISONTAL
    Saitama Prefecture Coronavirus Covid-19 Risk of Infection on May 14, 2020
    GET CODE >

Select HTML or Wordpress Code


HTML

WORDPRESS